This module is based on the Dropwizard framework for Java. One user told me about this framework and it’s cool stuff. Issue 128 talked about this feature. I added more cool features. Here are the features: healthcheck, profiling, statistics and tasks.
In v2.x, we plit toolbox into two pars, admin and task.
How to install
go get github.com/beego/beego/v2/core/admin
Healthcheck
It can check the health status of your application. E.g.: To check if database is available:
type DatabaseCheck struct {
}

func (dc *DatabaseCheck) Check() error {
    if dc.isConnected() {
        return nil
    } else {
        return errors.New("can't connect database")
    }
}
Then you can add it as a check item:
admin.AddHealthCheck("database",&DatabaseCheck{})
After this you can send get request to /healthcheck:
$ curl http://beego.vip:8088/healthcheck
* deadlocks: OK
* database: OK
It will return the database status accordingly.
Profiling
Monitoring the performance of running processes is a very good way to optimize performance and to look for issues in our application. E.g.: information of GC and goroutine.
Profile provides a easy entry point for you to debug the application. It uses the ProcessInput entry function to process the requests. Here are some debugging types:
lookup goroutine
Print out the tasks of all goroutines which are currently running. You can easily see what all goroutines are doing.
goroutine 3 [running]:
runtime/pprof.writeGoroutineStacks(0x634238, 0xc210000008, 0x62b000, 0xd200000000000000)
    /Users/astaxie/go/src/pkg/runtime/pprof/pprof.go:511 +0x7c
runtime/pprof.writeGoroutine(0x634238, 0xc210000008, 0x2, 0xd2676410957b30fd, 0xae98)
    /Users/astaxie/go/src/pkg/runtime/pprof/pprof.go:500 +0x3c
runtime/pprof.(*Profile).WriteTo(0x52ebe0, 0x634238, 0xc210000008, 0x2, 0x1, ...)
    /Users/astaxie/go/src/pkg/runtime/pprof/pprof.go:229 +0xb4
_/Users/astaxie/github/beego/toolbox.ProcessInput(0x2c89f0, 0x10, 0x634238, 0xc210000008)
    /Users/astaxie/github/beego/toolbox/profile.go:26 +0x256
_/Users/astaxie/github/beego/toolbox.TestProcessInput(0xc21004e090)
    /Users/astaxie/github/beego/toolbox/profile_test.go:9 +0x5a
testing.tRunner(0xc21004e090, 0x532320)
    /Users/astaxie/go/src/pkg/testing/testing.go:391 +0x8b
created by testing.RunTests
    /Users/astaxie/go/src/pkg/testing/testing.go:471 +0x8b2


goroutine 1 [chan receive]:
testing.RunTests(0x315668, 0x532320, 0x4, 0x4, 0x1)
    /Users/astaxie/go/src/pkg/testing/testing.go:472 +0x8d5
testing.Main(0x315668, 0x532320, 0x4, 0x4, 0x537700, ...)
    /Users/astaxie/go/src/pkg/testing/testing.go:403 +0x84
main.main()
    _/Users/astaxie/github/beego/toolbox/_test/_testmain.go:53 +0x9c
lookup heap
Print out information of current heap:
heap profile: 1: 288 [2: 296] @ heap/1048576
1: 288 [2: 296] @


# runtime.MemStats
# Alloc = 275504
# TotalAlloc = 275512
# Sys = 4069608
# Lookups = 5
# Mallocs = 469
# Frees = 1
# HeapAlloc = 275504
# HeapSys = 1048576
# HeapIdle = 647168
# HeapInuse = 401408
# HeapReleased = 0
# HeapObjects = 468
# Stack = 24576 / 131072
# MSpan = 4472 / 16384
# MCache = 1504 / 16384
# BuckHashSys = 1476472
# NextGC = 342976
# PauseNs = [370712 77378 0 0 0 0 0 0 0 0 0 0 0 0 0 0 0 0 0 0 0 0 0 0 0 0 0 0 0 0 0 0 0 0 0 0 0 0 0 0 0 0 0 0 0 0 0 0 0 0 0 0 0 0 0 0 0 0 0 0 0 0 0 0 0 0 0 0 0 0 0 0 0 0 0 0 0 0 0 0 0 0 0 0 0 0 0 0 0 0 0 0 0 0 0 0 0 0 0 0 0 0 0 0 0 0 0 0 0 0 0 0 0 0 0 0 0 0 0 0 0 0 0 0 0 0 0 0 0 0 0 0 0 0 0 0 0 0 0 0 0 0 0 0 0 0 0 0 0 0 0 0 0 0 0 0 0 0 0 0 0 0 0 0 0 0 0 0 0 0 0 0 0 0 0 0 0 0 0 0 0 0 0 0 0 0 0 0 0 0 0 0 0 0 0 0 0 0 0 0 0 0 0 0 0 0 0 0 0 0 0 0 0 0 0 0 0 0 0 0 0 0 0 0 0 0 0 0 0 0 0 0 0 0 0 0 0 0 0 0 0 0 0 0 0 0 0 0 0 0 0 0 0 0 0 0]
# NumGC = 2
# EnableGC = true
# DebugGC = false
lookup threadcreate
Print out information of threads:
threadcreate profile: total 4
1 @ 0x17f68 0x183c7 0x186a8 0x188cc 0x19ca9 0xcf41 0x139a3 0x196c0
#   0x183c7 newm+0x27           /Users/astaxie/go/src/pkg/runtime/proc.c:896
#   0x186a8 startm+0xb8         /Users/astaxie/go/src/pkg/runtime/proc.c:974
#   0x188cc handoffp+0x1ac          /Users/astaxie/go/src/pkg/runtime/proc.c:992
#   0x19ca9 runtime.entersyscallblock+0x129 /Users/astaxie/go/src/pkg/runtime/proc.c:1514
#   0xcf41  runtime.notetsleepg+0x71    /Users/astaxie/go/src/pkg/runtime/lock_sema.c:253
#   0x139a3 runtime.MHeap_Scavenger+0xa3    /Users/astaxie/go/src/pkg/runtime/mheap.c:463


1 @ 0x17f68 0x183c7 0x186a8 0x188cc 0x189c3 0x1969b 0x2618b
#   0x183c7 newm+0x27       /Users/astaxie/go/src/pkg/runtime/proc.c:896
#   0x186a8 startm+0xb8     /Users/astaxie/go/src/pkg/runtime/proc.c:974
#   0x188cc handoffp+0x1ac      /Users/astaxie/go/src/pkg/runtime/proc.c:992
#   0x189c3 stoplockedm+0x83    /Users/astaxie/go/src/pkg/runtime/proc.c:1049
#   0x1969b runtime.gosched0+0x8b   /Users/astaxie/go/src/pkg/runtime/proc.c:1382
#   0x2618b runtime.mcall+0x4b  /Users/astaxie/go/src/pkg/runtime/asm_amd64.s:178


1 @ 0x17f68 0x183c7 0x170bc 0x196c0
#   0x183c7 newm+0x27       /Users/astaxie/go/src/pkg/runtime/proc.c:896
#   0x170bc runtime.main+0x3c   /Users/astaxie/go/src/pkg/runtime/proc.c:191


1 @
lookup block
Print out information of block:
--- contention:
cycles/second=2294781025
start cpuprof
Start recording cpuprof info into created file cpu-pid.pprof.
stop cpuprof
Stop recording.
get memprof
Start recording memprof into created file mem-pid.memprof
gc summary
Check GC status:
NumGC:2 Pause:54.54us Pause(Avg):170.82us Overhead:177.49% Alloc:248.97K Sys:3.88M Alloc(Rate):1.23G/s Histogram:287.09us 287.09us 287.09us
Statistics
Look at this picture, what do you think? It’s cool, right? admin module supports it.
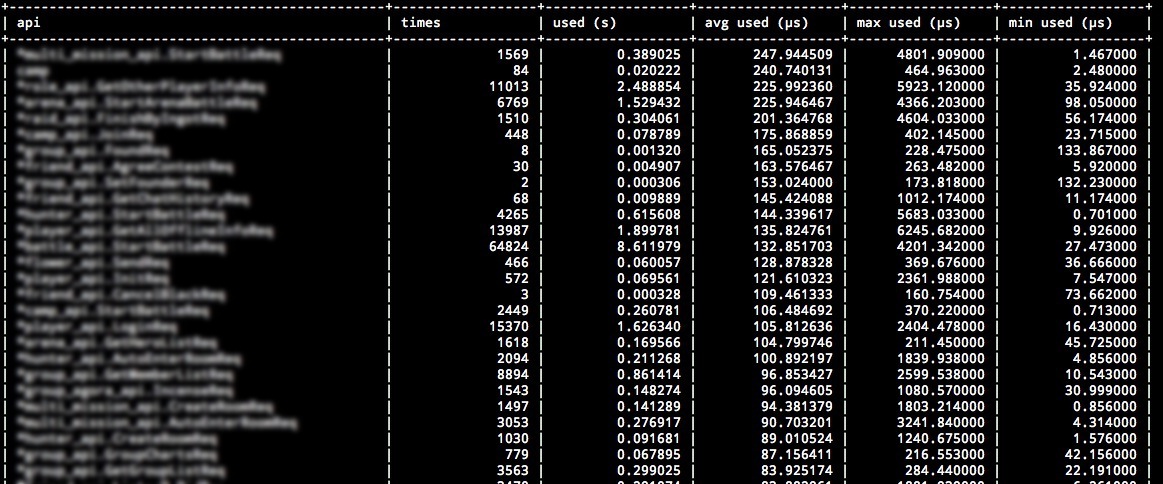
How can I use the statistics? Add statistics like this:
admin.StatisticsMap.AddStatistics("POST", "/api/user", "&admin.user", time.Duration(2000))
admin.StatisticsMap.AddStatistics("POST", "/api/user", "&admin.user", time.Duration(120000))
admin.StatisticsMap.AddStatistics("GET", "/api/user", "&admin.user", time.Duration(13000))
admin.StatisticsMap.AddStatistics("POST", "/api/admin", "&admin.user", time.Duration(14000))
admin.StatisticsMap.AddStatistics("POST", "/api/user/astaxie", "&admin.user", time.Duration(12000))
admin.StatisticsMap.AddStatistics("POST", "/api/user/xiemengjun", "&admin.user", time.Duration(13000))
admin.StatisticsMap.AddStatistics("DELETE", "/api/user", "&admin.user", time.Duration(1400))
Get statistics information:
admin.StatisticsMap.GetMap(os.Stdout)
Here is the output:
| requestUrl                                        | method     | times            | used             | max used         | min used         | avg used         |
| /api/user                                         | POST       |  2               | 122.00us         | 120.00us         | 2.00us           | 61.00us          |
| /api/user                                         | GET        |  1               | 13.00us          | 13.00us          | 13.00us          | 13.00us          |
| /api/user                                         | DELETE     |  1               | 1.40us           | 1.40us           | 1.40us           | 1.40us           |
| /api/admin                                        | POST       |  1               | 14.00us          | 14.00us          | 14.00us          | 14.00us          |
| /api/user/astaxie                                 | POST       |  1               | 12.00us          | 12.00us          | 12.00us          | 12.00us          |
| /api/user/xiemengjun                              | POST       |  1               | 13.00us          | 13.00us          | 13.00us          | 13.00us          |